Remote sensing and GIS techiniques to study Psa
During the National Conference on the kiwifruit bacterial canker (Psa) held in Latina, Italy on May 24-25, the research group of phytobacteriology (DAFNE), University of Tuscia, in close collaboration with the Spin Off-Terrasystem Ltd.(www.terrasystem.it), within the Project of Lazio Region on kiwifruit bacterial canker, presented the results of a pilot study developed in the area of Cisterna (LT province), by applying advanced techniques of remote sensing and GIS to monitor this bacterial disease.
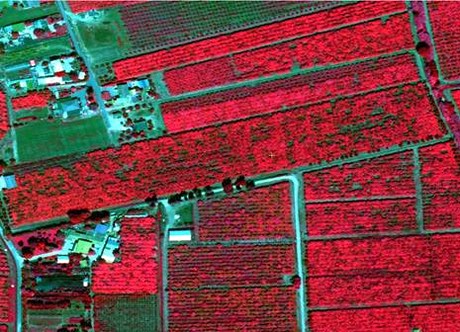
Aerial infra-red image of kiwi fruit areas affected by Psa.
The project, based on the electromagnetic spectrum and infra-red, investigats the reflectance curves emitted by the canopy of healthy and diseased kiwi fruit plants with the aim of developing computerized maps and to gain an overview of the spread/outbreak of the disease and to support strategies for containing the disease and be a valuable technological support, updated in real time, for plant protection services and more.

Reflectance curves of a healthy plant (left) and a diseased plant (right.).
Investigating large areas from the ground requires considerable financial resources, operational units have difficulty covering all the territory and are based on subjectivity and the operator. Through remote sensing, however, it is possible to analyse large areas in a very short time, covering the entire territory and then returning to geo-referenced maps in high detail at short notice.
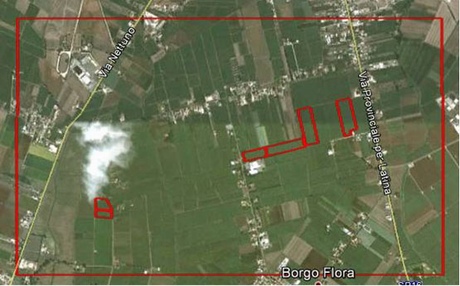
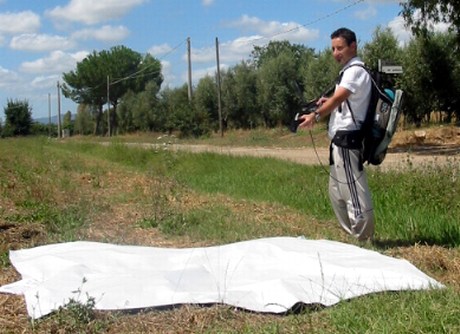
Above: study area (15 km2) investigated, south of Cisterna (Latina - Italy). Below: calibration on the ground to acquire spectroradiometric data.
The project specifically analysed the possibility of using innovative technologies and non-invasive monitoring of kiwifruit bacterial canker, using aircraft-satellite multi-spectral data, spatial analysis and geo-statistics.
During the study (season 2011), kiwifruit orchards were selected and individual plants of different kiwi fruit (A. chinensis and A. deliciosa) affected by Psa were screened. Then 2 flights were carried out over the area of investigation, 4 spectroradiometric samplings on plants with Psa, 6 assessments of the degree of illness, 2 samplings of reality on the ground, 1 year on plants with spectroradiometric woody decay, 1 spectroradiometric sampling of plants with chlorosis due to mineral deficencies.

The instruments used specially fitted to an ultralight plane.
Following the acquisition of data, a complex elaboration and statistical validation was done of those which provided a comparison with all the vegetation index from those known in the literature (66) calculated on data spectroradiometric dataset, in order to show a significant correlation between the degree of illness and the same vegetation index.
The elaboration highlighted that, for different indexes of vegetation, both in plants of A. chinensis (cv. Soreli) and of A. deliciosa (cv. Hayward), it had a high statistical significance in correlating the measurements from flight, compared to the degree of disease assigned with the findings on the ground. Similarly, it was clear and statistically significant that also an analysis of "false positives" (wood decay, mineral deficiencies) could be clearly distinguished.
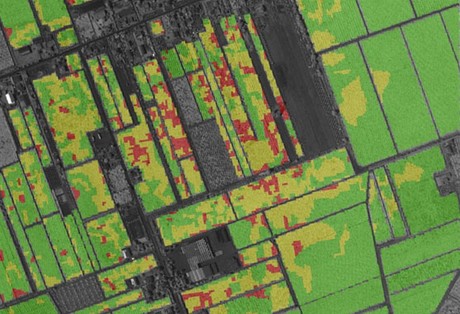
Geo-referenced map of the study compared the degree of disease previously developed.
In addition, after developing a geo-referenced map of the spread and intensity (incidence) of disease for the entire study area for July, it was possible to develop a further map, this time an estimate for the month of September, which then has demonstrated compliance with the terms it was found/verified in the field.